This article continues the discussion about IT Costs that started last week. While the last four questions where focused on creating transparency for the IT cost position with the remaining six points we want to dive a bit deeper and try to analyze where all the money goes and if it is aligned with the strategy
How are your costs distributed across capability domains?
Most organizations have a view on how the project portfolio is distributed across applications and across organizational units. The real strategic discussion should take place on the level of business capabilities and how the entire IT budget – change and run is distributed.
A visualization of such a budget could look like the following:
The dark bullets indicate the areas that are differentiating and the shading of the box is proportional to the money spend on the respective capability.
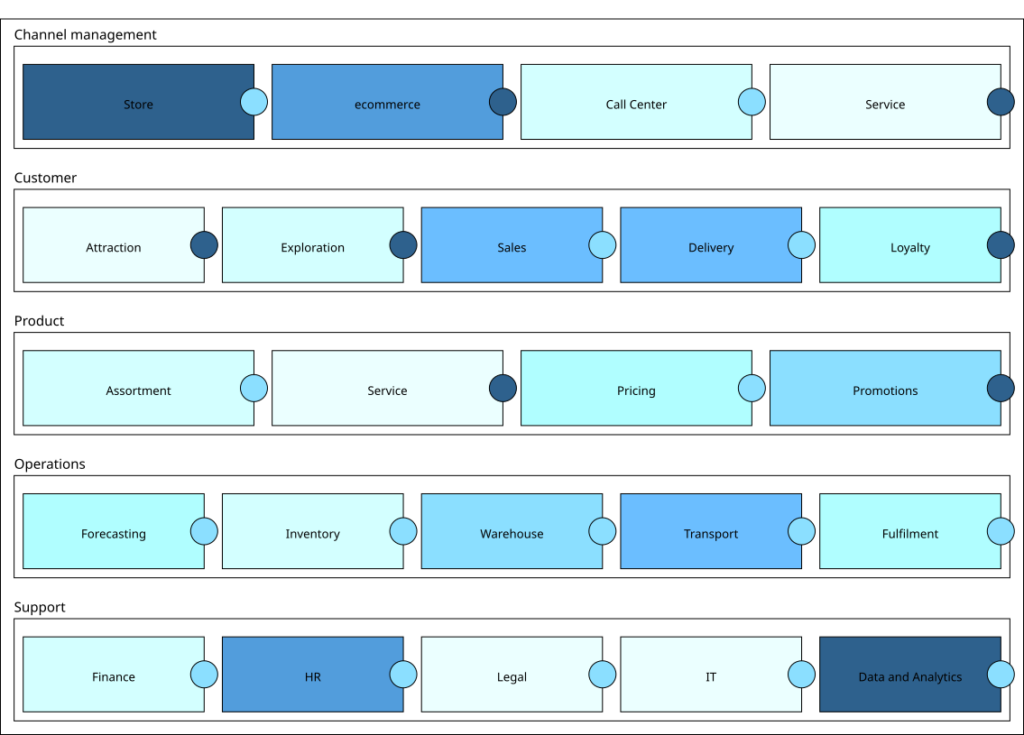
One can easily depict where most of the money is allocated and which domains are cheaper. Usually you want to have two views of this chart: One with the total cost and one only with the change budget. Having a view on total cost is important as it highlights areas where project costs are increasing the run cost in the long run (e.g., by increasing maintenance, due to lazy coding practices or missing quality control).
How much do you spend on differentiating capabilities vs. commodity?
For this overview to be the starting point of a strategy discussion it has to be linked to the strategic priorities. In this example it would be obvious that there is a much higher allocation of budget to the stores than to ecommerce, which is considered a differentiator, and more money flows into HR than into Promotions. There could be good reasons for this (such as a technical upgrade or legally required changes) but it for sure will improve the discussion in the top management team and help them to prioritize.
How does your IT cost compare to the industry’s average and lower quartile?
After the strategic priorities are clear the next question is how to reallocate the money. Usually there are always more ideas than resources and we therefore have to identify ways to save money in order to re-invest it into areas of high priority. The major sources of cost savings are:
- IT efficiency and productivity
- Adjusting sourcing and shoring
- Changes in the quality or the quantity of the outputs
- Stopping unnecessary work
There is an entire industry around benchmarking IT Costs and it makes a lot of sense to ask an external benchmarking provider like Gardner, Forrester or IDC to help with this job. But a lot of this work can also be done internally and by comparing with a few friendly companies.
For IT efficiency and productivity you want to have metrics for the run part (which is easy) and ideally also for the change part (which is hard).
For run efficiency it makes sense to break down the IT cost in a tree structure and benchmark each individual element (IT management, AM and Operations) with a few KPIs such as cost per ticket, cost per storage, etc.
For the change performance it is a bit painful but from my point of view a function point analysis is the only way to get a solid fact base that one can use to gauge the productivity of teams or departments.
If you combine these analysis with a view on internal vs. external and onshore vs. offshore ratios it usually quite quickly becomes obvious where cost could be reduced.
How does the quality of your output (e.g., velocity, website NPS, STP ratios, …) compare with competition?
However – cost is not the only relevant metric in IT. Otherwise Amazon would be the world’s worst retailer given that they spend 4-5 times as much on IT as a percentage of sales than anybody else in the industry. It also matters what “bang for buck” you are getting out of IT. Here the KPIs will be different from industry to industry.
In retail the key question might be how customers experience the website characteristics that directly depend on IT (e.g., loading time which is correlated with the conversion rate) or how fast a team can bring a new idea to the customer.
In banking or insurance the percentage of processes that run fully automated, the mean time to recover or the adherence to service levels (as well as their absolute value) might be important KPIs.
This also closes the circle to the first part of this topic as business stakeholder will have to understand that the cost for providing a service desk in 25 languages 24×7 is more expensive than providing the same service only in English and only during office hours.
What would be necessary to decrease costs by 10, 20 or 30%?
What would be the benefit of increasing costs by 10, 20, 30%?
So far most of the analysis show weaknesses and potential but as architects we should provide a proactive perspective on how to shape the future. In a highly simplified version this could like the following:
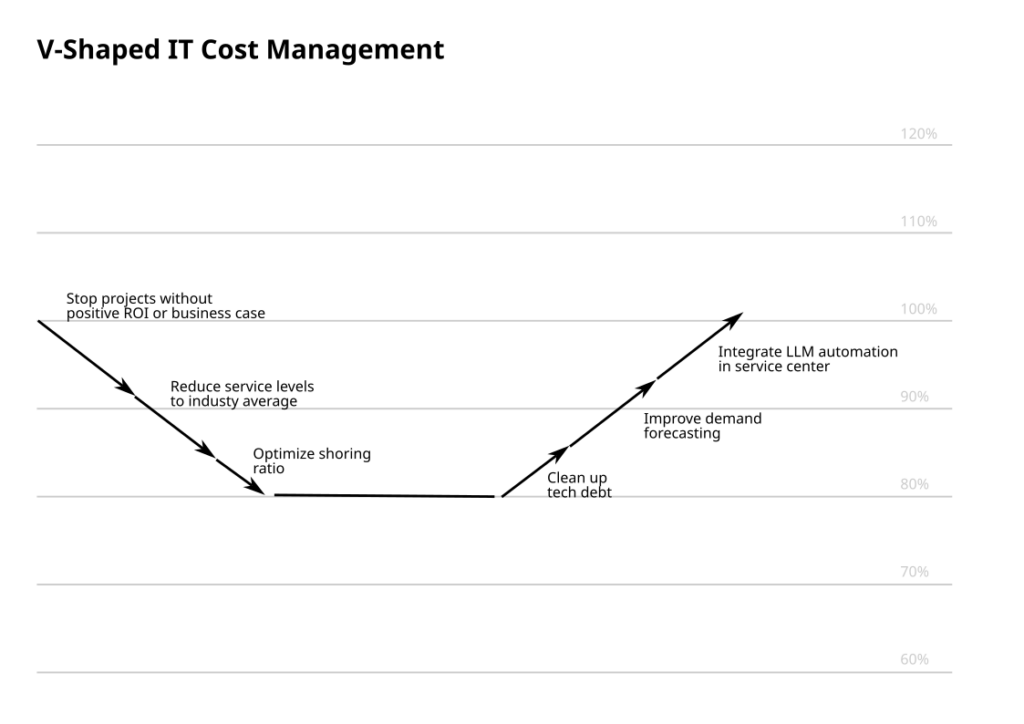
The important element of this graph is that it shows a way to go down and then go up again from this new baseline. Using this “V-Shape” in a discussion is essential as this way we are not asking for more investment into IT but rather aim for a more profitable re-distribution.
We should always combine the savings potential with the potential for increasing the business benefits and new opportunities by better enabling the company with technology.
Pingback: Let’s Talk about IT Costs – Enterprise Architecture