When I was working in consulting I had the luxury of a large group of back office colleagues being focused on creating and modifying PowerPoint slides. This was in particular helpful when working with and re-arranging capability maps. As I am a huge fan of capability maps I also use them today on a regular basis.
As I no longer have handful human hands in the background to update these maps I created a quick and dirty Python script that I now released under the GPL and that can be found here. The tool is very simple and helps to create capability maps from a proprietary *.cap file.
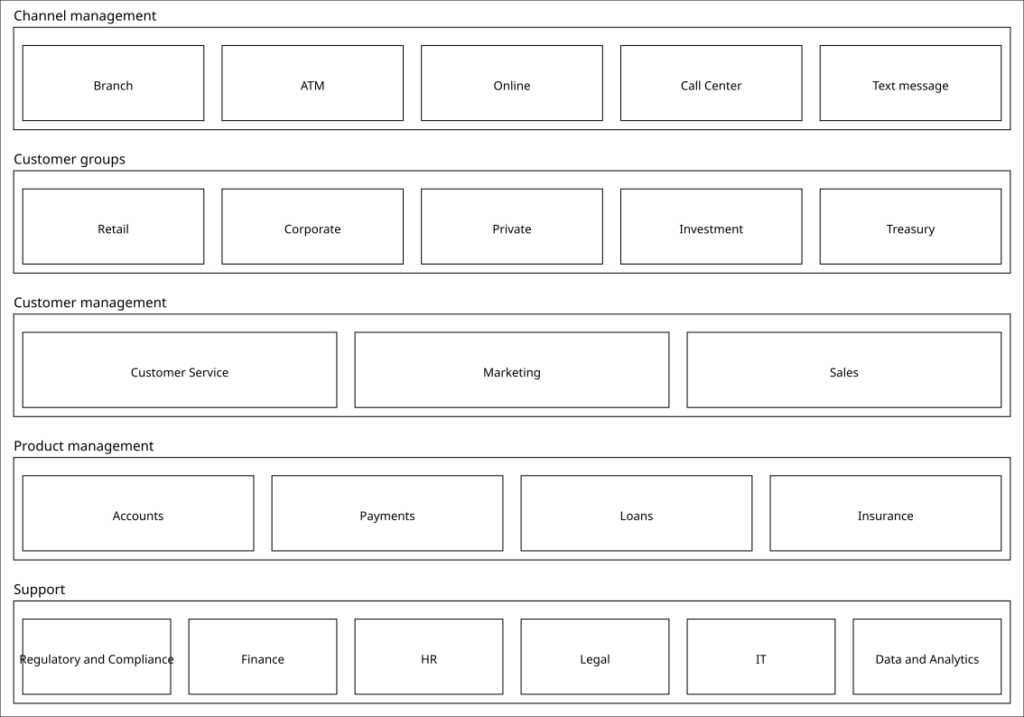
Here is an example file for a high level capability map for a bank:
Channel management
	Branch
	ATM
	Online
	Call Center
	Text message
Customer groups
	Retail
	Corporate
	Private
	Investment
	Treasury
Customer management
	Customer Service
	Marketing
	Sales
Product management
	Accounts
	Payments
	Loans
	Insurance
Support
	Regulatory and Compliance
	Finance
	HR
	Legal
	IT
	Data and Analytics
---
# Channel management
Branch,data,1
ATM,data,1
Online,data,1
Call Center,data,1
Text message,data,1
# Customer groups
Retail,data,3
Corporate,data,3
Private,data,3
Investment,data,3
Treasury,data,3
# Customer management
Customer Service,data,1
Marketing,data,1
Sales,data,1
# Product management
Accounts,data,3
Payments,data,1
Loans,data,1
Insurance,data,3
# Support
Regulatory and Compliance,data,1
Finance,data,1
HR,data,1
Legal,data,1
IT,data,1
Data and Analytics,data,1

# Channel management
Branch,cloud,1
ATM,cloud,1
Online,cloud,2
Call Center,cloud,3
Text message,cloud,1
# Customer groups
Retail,cloud,1
Corporate,cloud,1
Private,cloud,1
Investment,cloud,1
Treasury,cloud,1
# Customer management
Customer Service,cloud,3
Marketing,cloud,1
Sales,cloud,1
# Product management
Accounts,cloud,1
Payments,cloud,1
Loans,cloud,1
Insurance,cloud,3
# Support
Regulatory and Compliance,cloud,1
Finance,cloud,3
HR,cloud,3
Legal,cloud,1
IT,cloud,3
Data and Analytics,cloud,2
The upper portion of the file defines the structure and the lower part attributes one wants to map on the domains. On the command line we can now create a few simple visualizations.
If we run the command
$ python generate_capability_map.py bank.capthe script will create the following output:

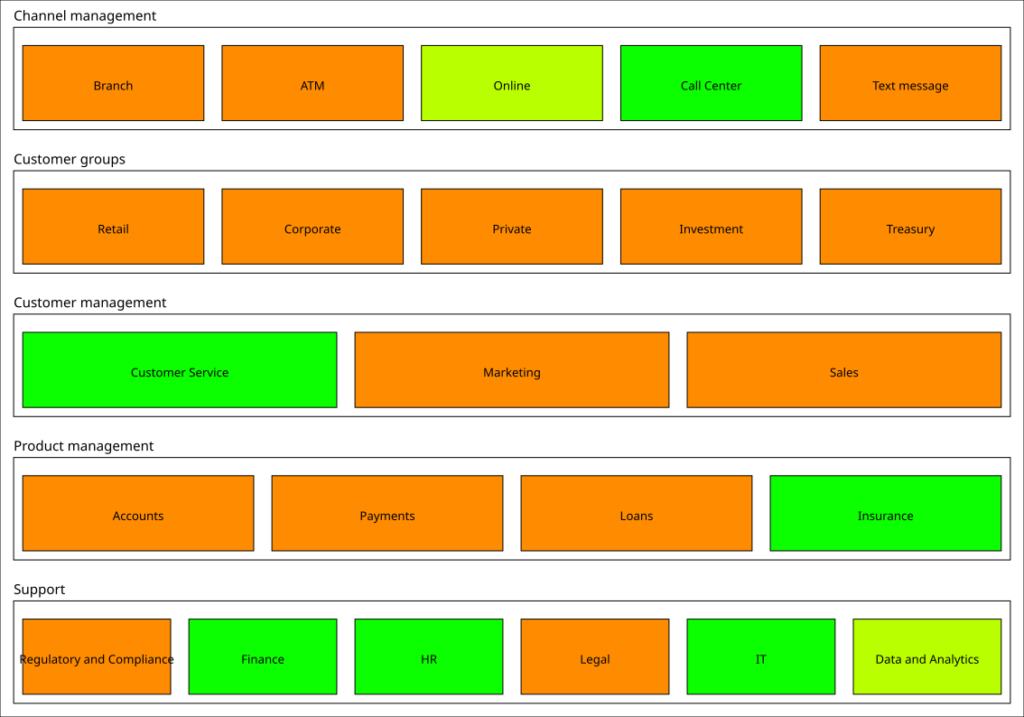
When using one of the parameters
$ python generate_capability_map.py bank.cap -c cloud -m 3 -o bank_cloud.svgWe get a color-coded version of the same map:

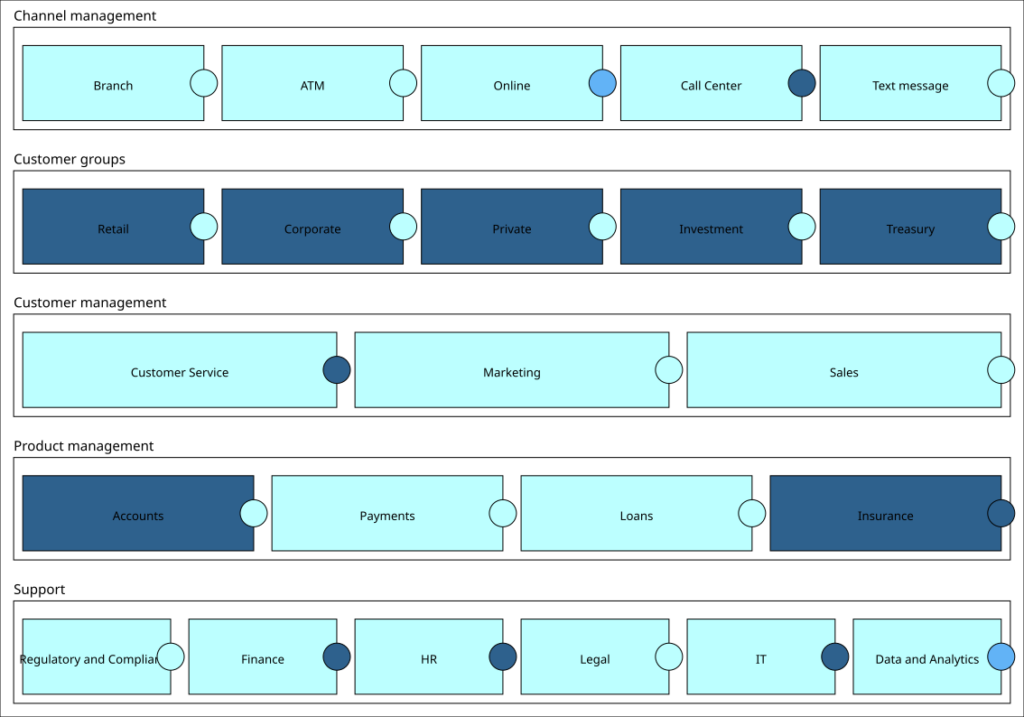
And lastly we can also compare two parameters:
$ python3 generate_capability_map.py bank.cap -c data -t 'Data criticality and cloud usage' -m 3 -x blues -b cloud -y blues -n 3 -o 'bank_data_cloud.svg'which then creates the following chart:

I hope this tool is useful for some of you that want to have a way to quickly iterate on capability maps.

Pingback: Visualizing tech debt – Enterprise Architecture