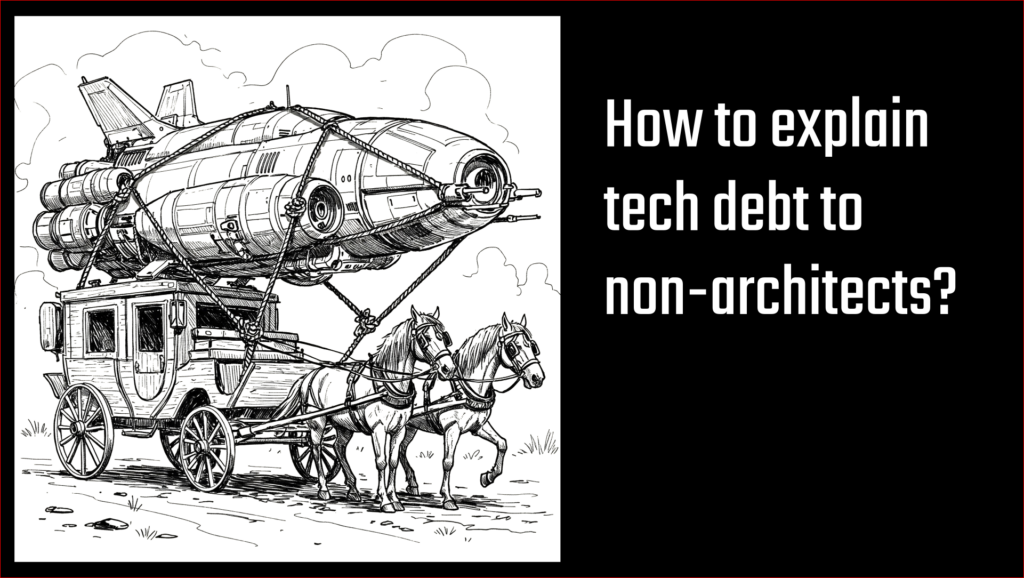
Are you building the brand new star ship on top of a horse and carriage? This is what we do a lot in a large Enterprise context these days. We build fancy new solutions, like AI or direct to customer solutions on top of the technical debt of the last decades. One major problem is that the concept of technical debt is clear to most engineers and architects but is very hard to communicate to non-technical people.
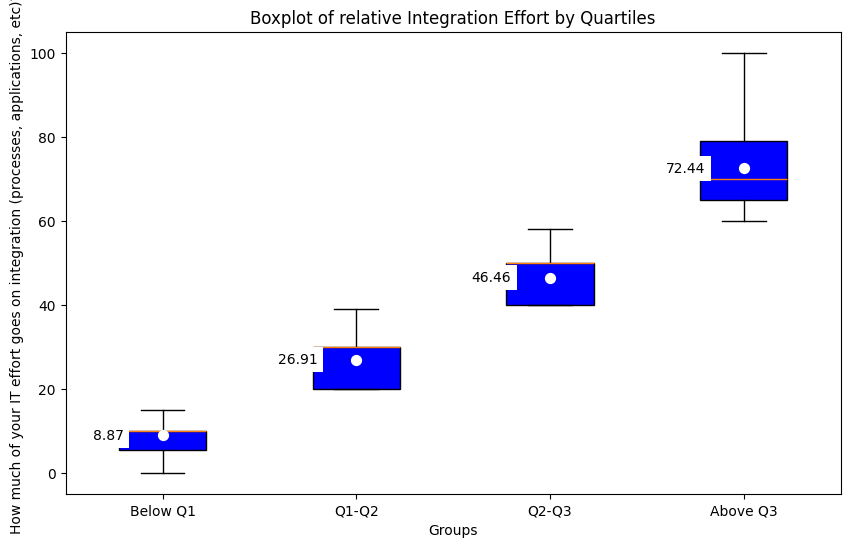
For me what worked quite well in the past is to use the effort that goes into integration efforts as a very tangible way to explain the concept of technical debt. In our Enterprise Architecture survey we asked the question how much of the IT effort goes into integration and the following chart shows the averages of the four quartiles:

There are three different analogies for different stakeholder groups that worked for me:
Lean Management
When working with stakeholders from a manufacturing or logistics background this chart can be nicely translated into the Lean methodology. Everyone that was involved in a lean transformation at some point in time will immediately understand that fiddling around with integrations is not adding direct value to the end customer and is considered “waste”.
In these discussions it can be quite helpful to break the time of the teams into a “value adding” bucket where the team is producing features the customer is willing to pay for and a “waste” bucket with integration work and updating spaghetti code that no one really wants.
Most of the time experiences lean managers will not be shocked that there is more than 70% waste in the system as they might have seen similar numbers in their own domain. They will also understand how much of a payback one can expect from a transformation in this area.
Effectiveness and Opportunity Cost
For people with a more financial background it is helpful to convert the numbers from utilization into Euros or Dollars. For that we start with a few assumptions:
- A developer costs 50.000 EUR per year
- That person delivers 1 unit of output (like story points) per day
- We have a project with an effort of 1.000 output units
If we take the values from the chart above and apply some elementary math the same output of 1.000 units will cost
- 55.000 EUR for the lowest quartile
- 68.000 EUR for the second quartile
- 93.000 EUR for the third quartile
- 181.000 EUR for the highest quartile
Even when technical debt requires a high investment there could be a very good return on investment when moving from category 4 into one of the lower ones.
Calendar week
If Lean and Finance are nothing the stakeholder can relate to the simplest way to bring technical debt to life is using a 5 day work week and ask the simple question how much time the teams actually have to work on the future of the company.
- Teams in the lowest category are actually able to work till Friday afternoon on the future and then only have to work for a few hours on non-value adding integration tasks (less than half a work-day)
- Teams in the second quartile already need the entire Friday and part of the Thursday afternoon to fix integration topics.
- The third quartile will stop half-way through the week (around Wednesday noon) working on the future and will deal with issues from the past for the rest of the week
- And those that are in the worst quartile will spend all the time as of Tuesday morning on things no one in willing to pay for
I used these and similar analogies quite often in the past and was quite successful in convincing stakeholder to take the topic serious. Clearly creating awareness is only the first step but it is an important foundation to work on the topic.

Pingback: How to measure tech debt? – Enterprise Architecture
Pingback: Charging back technical debt – Enterprise Architecture
Pingback: Visualizing tech debt – Enterprise Architecture